平台
Windows 10
Unity 2020.3
Unity Web插件:Embedded Browser2.1
Web前端框架:Vue.js+Element UI
数据可视化工具:ECharts
Unity配置
首先在ECharts官网下载dist文件夹(编译好的目标文件),并将其放置在Unity工程文件夹下的BrowserAssets文件夹中(没有则新建,名字必须一样),并新建一个html文件用于编写web界面。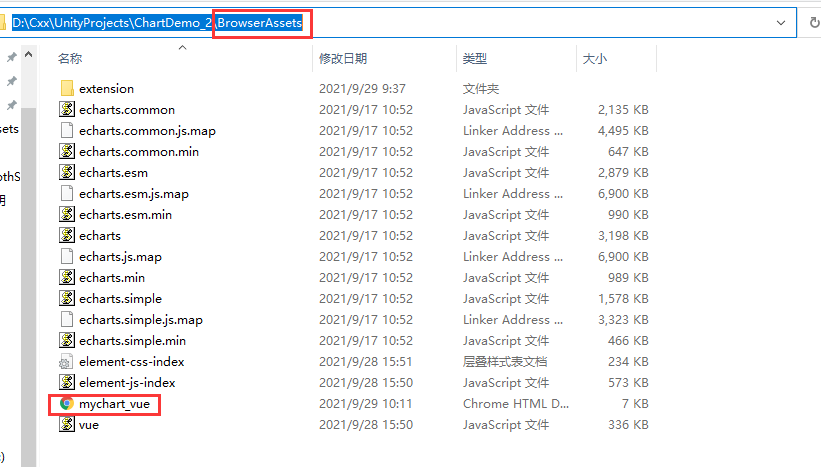
然后将Embedded Browser插件导入到工程中,并在Prefabs中找到BrowserGUI控件,将其放置在Canvas中。
然后更改其Rect Transform属性,放置到合适的位置,将Browser(Script)属性下的Url参数更改为刚才新建的html文件: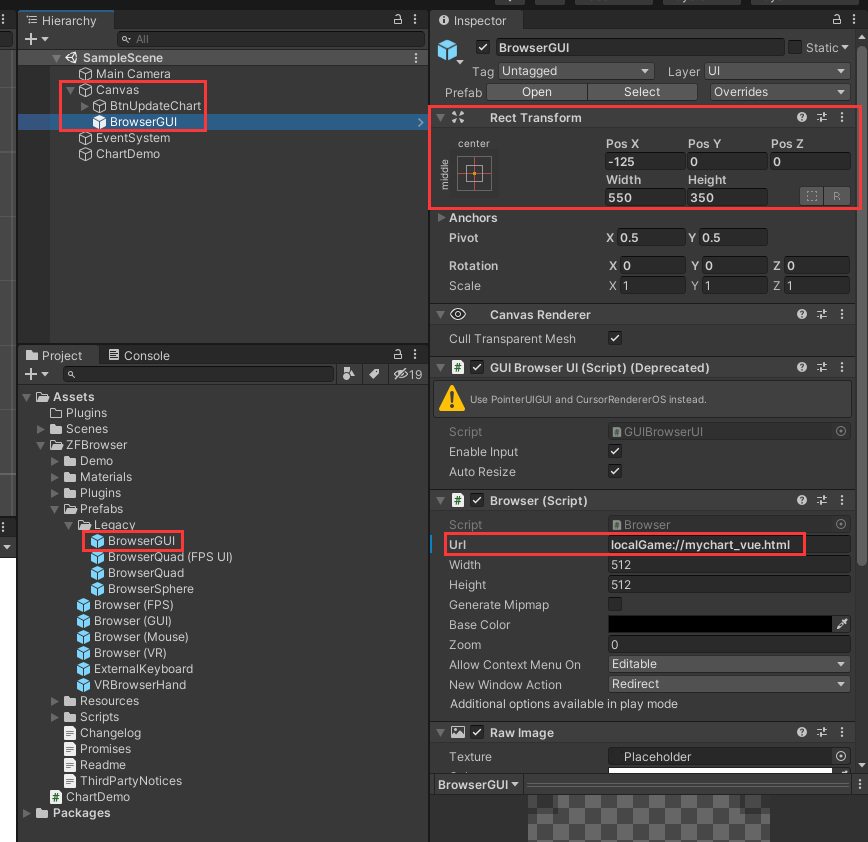
最后挂载一个脚本用于处理程序逻辑。
Web前端配置
mychart_vue.html:1
2
3
4
5
6
7
8
9
10
11
12
13
14
15
16
17
18
19
20
21
22
23
24
25
26
27
28
29
30
31
32
33
34
35
36
37
38
39
40
41
42
43
44
45
46
47
48
49
50
51
52
53
54
55
56
57
58
59
60
61
62
63
64
65
66
67
68
69
70
71
72
73
74
75
76
77
78
79
80
81
82
83
84
85
86
87
88
89
90
91
92
93
94
95
96
97
98
99
100
101
102
103
104
105
106
107
108
109
110
111
112
113
114
115
116
117
118
119
120
121
122
123
124
125
126
127
128
129
130
131
132
133
134
135
136
137
138
139
140
141
142
143
144
145
146
147
148
149
150
151
152
153
154
155
156
157
158
159
160
161
162
163
164
165
166
167
168
169
170
171
172
173
174
175
176
177
178
179
180
181
182
183
184
185
186
187
188
189
190
191
192
<html>
<head>
<meta charset="utf-8">
<title>ECharts</title>
<!-- 引入 echarts.js -->
<script src="echarts.min.js"></script>
<!-- import CSS -->
<link rel="stylesheet" href="element-css-index.css">
</head>
<!-- import Vue before Element -->
<script src="vue.js"></script>
<!-- import JavaScript -->
<script src="element-js-index.js"></script>
<body>
<div id="app" style="width:530px;height:320;" class="div-app">
<el-row :gutter="15">
<el-col :span="18">
<div id="main" class="div-main-chart" style="width:400px;height:300px;"></div>
</el-col>
<el-col :span="6">
<div>
<el-button type="primary" @click="updateChartAuto">{{ updateChartBtnName }}</el-button>
</div>
</el-col>
</el-row>
</div>
</body>
<script type="text/javascript">
new Vue({
el: '#app',
data() {
return {
chartDom: null,
myChart: null,
option: null,
categories: [],
data: [],
isUpdateChart: false,
updateChartInterval: null,
updateChartBtnName: "动态更新"
}
},
created () {
this.initOption()
},
mounted () {
this.chartDom = document.getElementById('main')
this.myChart = echarts.init(this.chartDom)
// 使用刚指定的配置项和数据显示图表。
this.myChart.setOption(this.option);
// 在vue的钩子函数中将需要调用的函数赋值给window。
window.updateChart = this.updateChart;
window.updateChartAuto = this.updateChartAuto
},
methods: {
initOption() {
this.option = {
title: {
text: 'Estun Medical',
x: 'center',
y: 'top',
},
// 悬浮框,鼠标放置在数据上面时的响应
tooltip: {
trigger: 'axis',
axisPointer: {
type: 'cross',
label: {
backgroundColor: '#283b56'
}
}
},
legend: {
x: 'right'
},
// 右上角小工具
toolbox: {
show: false,
feature: {
dataView: { readOnly: false },
restore: {},
saveAsImage: {}
}
},
dataZoom: {
show: true,
start: 0,
end: 100
},
// 和下面的系列对应,有几个图就有几个坐标系轴
xAxis: {
// 坐标轴类型。'value' 数值轴,适用于连续数据。'category' 类目轴,适用于离散的类目数据
type: 'category',
boundaryGap: true,
// data: this.categories
},
yAxis: {
type: 'value',
scale: true,
name: 'Number',
max: 30,
min: 0,
boundaryGap: [0.2, 0.2]
},
// 系列,即包含几种图
series: {
name: 'Number Line',
type: 'line',
// data: this.data
}
};
},
updateChartAuto() {
if (this.isUpdateChart) {
this.isUpdateChart = false
this.updateChartBtnName = '动态更新'
clearInterval(this.updateChartInterval)
}else{
this.updateChartBtnName = '暂停更新'
this.updateChartInterval = setInterval(() => {
this.isUpdateChart = true
let axisData = new Date().toLocaleTimeString().replace(/^\D*/, '');
// shift() 方法用于把数组的第一个元素从其中删除,并返回第一个元素的值。
if (this.data.length > 10){
this.data.shift();
}
this.data.push(Math.round(Math.random() * 30));
if (this.categories.length > 10) {
this.categories.shift();
}
this.categories.push(axisData);
this.myChart.setOption({
xAxis: {
data: this.categories
},
series: {
data: this.data
}
});
}, 1000)
}
},
updateChart(xData, yData) {
let axisData = xData
// shift() 方法用于把数组的第一个元素从其中删除,并返回第一个元素的值。
if (this.data.length > 10){
this.data.shift();
}
this.data.push(yData);
if (this.categories.length > 10) {
this.categories.shift();
}
this.categories.push(axisData);
this.myChart.setOption({
xAxis: {
data: this.categories
},
series: {
data: this.data
}
});
}
}
})
function updateChart(xData, yData) {
updateChart(xData, yData)
}
function updateChartAuto() {
updateChartAuto()
}
</script>
<style type="text/css">
.div-app{
/* border: 2px solid #FF0000; */
}
.div-main-chart{
border: 2px solid #008B93;
}
</style>
</html>
这里主要实现了能够自动增加数据的动态折线图显示。比较重要的一点是,在Vue框架中,需要使用钩子函数将其内部函数传给Windows(window.updateChart = this.updateChart;),否则在Unity中无法找到该函数。
Unity编译运行
Unity脚本控制:1
2
3
4
5
6
7
8
9
10
11
12
13
14
15
16
17
18
19
20
21
22
23
24
25
26
27
28
29
30
31
32
33
34
35
36
37
38
39
40
41
42
43
44
45
46
47
48
49
50
51
52
53using System.Collections;
using System.Collections.Generic;
using System.Data;
using UnityEngine;
using UnityEngine.UI;
using ZenFulcrum.EmbeddedBrowser;
public class ChartDemo : MonoBehaviour
{
public Browser browser;
// Start is called before the first frame update
void Start()
{
// 添加按钮对象
List<string> btnsName = new List<string>();
btnsName.Add("BtnUpdateChart");
foreach (string btnName in btnsName)
{
GameObject btnObj = GameObject.Find(btnName);
Button btn = btnObj.GetComponent<Button>();
btn.onClick.AddListener(delegate () {
this.OnClick(btnObj);
});
}
}
// 响应按钮点击事件
public void OnClick(GameObject sender)
{
switch (sender.name)
{
case "BtnUpdateChart":
// Debug.Log("BtnUpdateChart");
// browser.CallFunction("updateChart", 1, 10).Done();
browser.CallFunction("updateChartAuto").Done();
// UpdateChart(barChart);
break;
default:
Debug.Log("none");
break;
}
}
// Update is called once per frame
void Update()
{
}
}
Unity调用web的方法函数为:browser.CallFunction("functionName", functionparams).Done();,然后将刚才的BrowserGUI控件挂载到该脚本上即可。
最后编译打包即可。